The numbers that matter most when you read Tour pace
- Overall race pace in the modern Tour is usually close to 40 km/h, or about 25 mph.
- Flat sprint stages often sit in the mid-40s km/h, and the fastest days can climb above 50 km/h.
- Time trials are the quickest individual efforts because riders do not get the same drafting benefit.
- Mountain stages are slower on paper, but they can be brutally hard because speed drops while power stays high.
- For everyday cyclists, compare rides by terrain and conditions, not by one generic average number.
What the average speed usually looks like
If I need one working benchmark, I start with 39 to 41 km/h for a modern overall Tour pace. That is not a fixed rule, but it is a useful ballpark for the kind of speed the yellow jersey group can sustain across three weeks of racing.
| Stage or race context | Typical speed | What it usually means |
|---|---|---|
| Overall three-week average | 39-41 km/h (24-25.5 mph) | A good benchmark for a modern general classification Tour |
| Flat sprint stage | 45-50 km/h (28-31 mph) | Fast lead-outs, controlled chases, and a high-speed finish |
| Hilly or rolling stage | 39-43 km/h (24-27 mph) | Attacks, regrouping, and enough climbing to interrupt rhythm |
| Mountain stage | 34-39 km/h (21-24 mph) | Slower average, but a much higher sustained effort |
| Individual time trial | 48-55 km/h (30-34 mph) | Solo speed, aero position, and no drafting advantage |
I treat those figures as a map, not a law. A flat stage can still be conservative if the wind is calm and teams are waiting for the final hour, while a crosswind day can turn a seemingly normal stage into a full-speed fight for position. The distance matters, but the race script matters more.
That is why the real answer is not just “how fast,” but “fast under what conditions.”
Why the pace swings so much from stage to stage
The biggest mistake I see is comparing a mountain stage to a sprint stage as if they were the same test. They are not. The Tour is built to force different kinds of racing, and each one changes the average speed in a different way.
Terrain changes the effort before the speed shows it
Climbing naturally lowers the number on the speedometer, but that does not mean the stage is easier. On a steep ascent, riders can be working at race-winning power while the pace looks modest. Descents, technical corners, and false flats also disrupt the average, because the group is constantly accelerating and braking rather than rolling smoothly.
Drafting keeps the bunch unnervingly fast
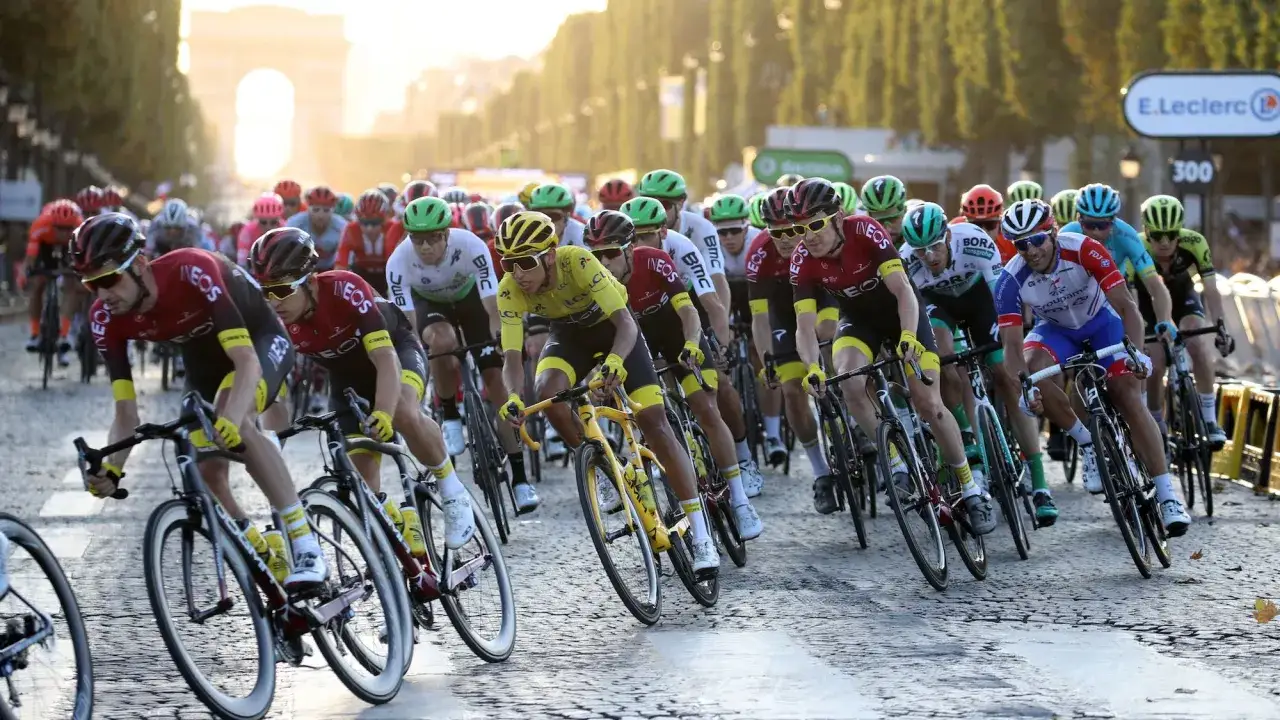
In a peloton, riders save a huge amount of energy by sitting in the slipstream. That is why a group can sit at 45 km/h and still feel relatively controlled for the riders near the front and middle of the bunch. The same speed solo would be a very different story. This is the hidden engine behind Tour racing: the speed is a team effect, not just a legs effect.
Read Also: Giro d'Italia Winner - How Vingegaard Conquered the Mountains
Wind and tactics can change the headline number
A tailwind can make a stage look outrageous, while a headwind can drag the average down even when the effort is huge. Crosswinds are even more dramatic because they can split the peloton and force teams to chase in narrow, stressful lines. Breakaways matter too. If the leaders let a move go for a long time, the stage may settle into a slower rhythm; if the sprint teams decide to reel it back, the last 50 kilometers can become a high-speed burn.
Once you look at the race by stage type instead of by distance alone, the numbers stop looking random and start making sense. The best way to prove that is to look at a few recent examples.
What recent Tour stages tell us
Recent official race data shows just how wide the range can be. These are not perfect apples-to-apples comparisons, but they show why one average speed number never tells the full story.
| Example | Speed | Why it matters |
|---|---|---|
| A 174.1 km stage in 2025 | 50.013 km/h | Proof that a controlled stage can still become brutally fast when the sprint teams and breakaway fight all day |
| A 33 km individual time trial in 2025 | 54.0 km/h | A reminder that the fastest Tour speeds usually come in solo efforts on aero bikes |
| The first hour of the longest 2024 stage | 37.3 km/h | Long stages are not automatically fast; the opening tempo can be surprisingly restrained |
| A modern overall Tour benchmark | About 40 km/h | The number I would use for a typical recent winner, give or take a little depending on the route |
Those figures also show why time trials and bunch stages should never be lumped together. A solo specialist can post a very high average because the course is short, direct, and aero-friendly. A mountain stage can look slower even when it is one of the hardest days in the race. The speed is only half the story; the effort behind it is the real measure.
That contrast becomes even clearer when you compare the Tour with ordinary road riding.
How Tour speed compares with ordinary road riding
For riders in the United States, I think mph is often the easier mental shortcut. Here is the comparison I usually give:
| Riding situation | Typical flat-ground speed | What to expect |
|---|---|---|
| Solo recreational ride | 15-18 mph (24-29 km/h) | Comfortable endurance pace, often shaped by stops and wind |
| Fast group ride | 18-22 mph (29-35 km/h) | Drafting starts to matter a lot, so the group goes faster than the solo rider |
| Strong amateur race or hard bunch ride | 23-26 mph (37-42 km/h) | Closer to pro-like rhythm, especially on flat roads with a committed group |
| Tour overall pace | 24-25 mph (39-41 km/h) | That is the average across the whole race, not the speed on every climb or descent |
The gap is smaller than many people expect because the peloton gifts speed to everyone who can stay in it. The hard part is not doing 25 mph for one minute. The hard part is doing it after climbs, in bad weather, through repeated accelerations, and while carrying the fatigue of stage racing.
That is also why speed comparisons can be misleading if you ignore the context. A rider on a solo training loop is fighting the wind alone; a Tour rider is often fighting it with a small army of teammates around them.
What this means for training and gear
If you ride road bikes, the Tour is useful less as a target and more as a lesson in what actually creates speed. I would not train by chasing a generic average speed goal. I would train for the conditions that create speed in the first place: steady power, efficient positioning, and the ability to repeat hard efforts without fading.
For training, speed is a blunt tool. I trust power, heart rate, and route profile more because traffic, stops, and wind can change the speed by several mph without telling you much about your fitness. If you want a Tour-style lesson from the pros, the real takeaways are more practical:
- Position matters because a narrow, stable body shape cuts drag.
- Fast-rolling tires matter because small rolling-resistance gains add up over long rides.
- Aero clothing matters once the pace gets high enough that air resistance becomes the main enemy.
- Fueling matters because speed collapses fast when the energy intake is too low.
- Similar-route comparisons matter because one windy day is not a fair benchmark for the next.
If I were choosing where to spend money first, I would usually look at fit, clothing, tires, and position before chasing flashy upgrades. That is the same logic the best teams use: they squeeze free speed out of the rider before they obsess over the equipment.
Once you think that way, Tour speeds stop being a trivia stat and start becoming a useful performance clue.
The one way I would read the speed sheet
My rule is simple: compare like with like. Flat sprint stage to flat sprint stage. Mountain day to mountain day. Time trial to time trial. If you do that, the average speed becomes a good clue about how the race was ridden, not just how fast the numbers look on paper.
A very fast flat stage usually means the teams controlled the race hard, the wind helped, or both. A slower mountain stage does not mean the race was soft; it often means the terrain was demanding enough that speed was a poor proxy for effort. And a time trial should always be treated separately, because it is a different discipline with a different speed ceiling.
For most cyclists, the simplest answer is still the useful one: expect roughly 40 km/h overall, much faster on flat or time-trial days, and slower once the climbs bite. Read the context first, then the number, and you will understand the Tour better than most spectators ever do.